See, Fix, Supercharge: How Gutsy's Dashboards Solve Common Security Challenges
Get unprecedented visibility into security workflows, crucial KPIs and your organization's overall effectiveness in delivering outcomes
Jacob Graves | December 5, 2023

Getting an overarching view of one of your security processes can be difficult. Most organizations are lucky just to have a document to describe the rough outline of a best-case process. Using Gutsy, security leaders have unprecedented visibility into their security workflows, including metrics about the performance and efficacy of each process.
In Gutsy’s new 23.11 release, dashboards tailored for security leaders provide crucial KPIs and an overview of your organization’s effectiveness in delivering outcomes.
Why it Matters
Security leaders are responsible for the security of their organizations. Not only are they responsible for the direct security policies and posture, but they are also responsible for reporting the results of their security program to their leaders (usually the board). Even with a modern set of security tools, the data sets are usually dozens of disjointed tools reporting their own sets of detections.
Resultantly, just collecting the data to attest to all the good work the security team is doing is a project in and of itself. Like many other security leaders, you may use consultants, create an internal task force, or just cobble together graphs from spreadsheet exports. Then, after building your report, you find yourself having to recreate the whole exercise again next quarter.
Gutsy’s Performance Management Dashboards offer a modern data-driven approach to this problem. Rather than a periodic manual effort, security leaders now have continuous insight into the performance of their security processes. The metrics for each process are displayed in interactive graphs and charts, giving a high-level view of the efficacy of security practices at a glance.
Gutsy’s highly visual graphs can be used on board slides and internal reports and are a consistent place from which data can be pulled quarter after quarter to give a solid baseline for measuring security performance.
Dashboard Features
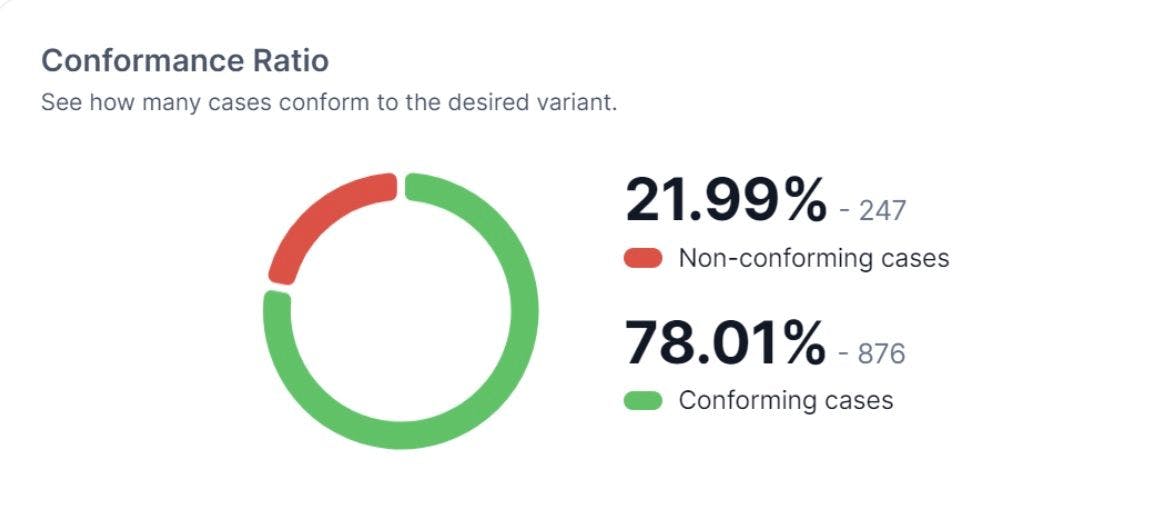
Conformance Ratio
One key indicator of the effectiveness of your processes is the conformance ratio. Conformance ratio is the percentage of cases where you’re following an accepted variant of a process. For instance, in the case of an incident response process, your target process will be one where the operator follows your specified playbook steps in order.
Non-conformant processes could be the case where a high-severity incident is detected but never addressed or when an operator skips a step in your incident response playbook.
Gutsy tracks your conformance ratio so you can understand, at a glance, if your process is running as expected.
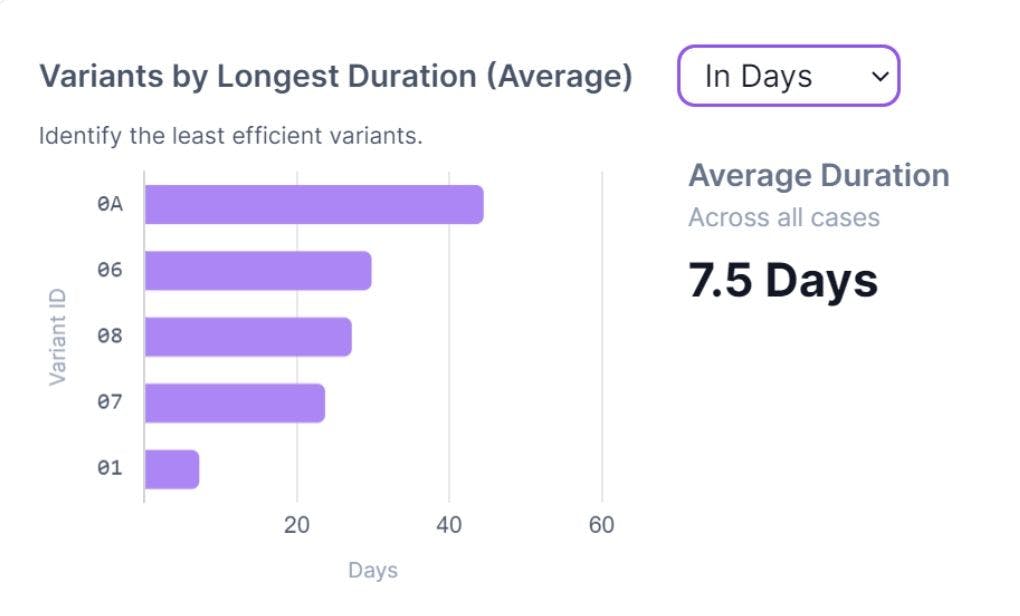
Longest Variants
In security, any additional time to execute a process is highly correlated with risk to the organization. Gutsy’s process dashboard highlights the least efficient variants of your process so you can focus your efforts on process optimization.
Maybe, upon investigation, you realize that the longest variants always involve patching a resource in your data center rather than in your cloud provider. Now you have the insight needed to refine that inefficient part of your process and lower the overall risk to the organization.
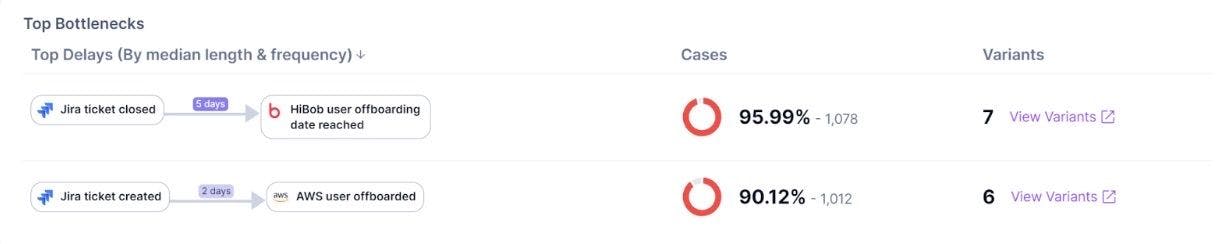
Top Bottlenecks
Some steps take longer to complete than others. These are typically the places where you’ll get the highest return on investment for reimagining your process. If you see that your top bottleneck for offboarding users is a manual process for de-provisioning a user in a disconnected system, you may choose to employ automation to turn this into a near-instantaneous process.
The Top Bottlenecks widget gives you a quick view into the main offenders in your processes and helps you focus your energy on remediating these pile-ups and logjams.
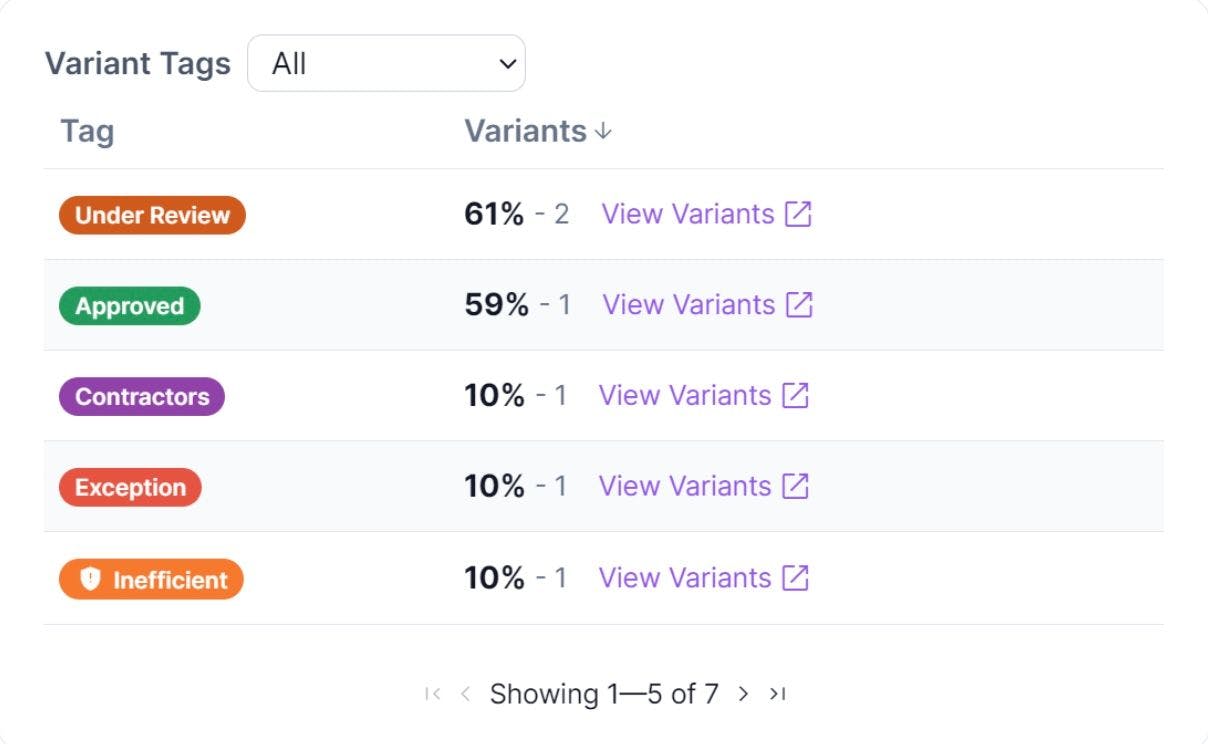
Tracking Variants by Tags
Helping you organize your process findings and insights is a fundamental goal of Gutsy. In 23.11, Gutsy introduces variant tags, with the ability to apply tags to variants within a process.
These could be standard tags like “Risk” or “Inefficient,” down to very custom tags like “Owner=Devops” or “Imported in Acme Co Acquisition.” After you review your variants, you may want to record valuable observations so you and others will better understand the data in the future.
Gutsy’s new dashboard will show metrics based on these tags so you can quickly see which variants are dominant among your processes and where you and others have recorded insights about your workflow.
Book a demo to see Gutsy's new dashboard in action. Get metrics based on tags, quickly find process variants, and enable teams to work more efficiently with recorded workflow insights.